If your Facebook advertising is struggling to impact sales – and you want fast, effective strategies to help you gain incredible returns – this article is a must read.
We were recently given a failing Facebook ad campaign and tasked with the ultimate marketing challenge of turning it around.
![]()
Not only did we succeed – we transformed the campaign into a highly profitable one for a very happy e-commerce client.
In this case study, I’ll take you on a step by step journey of:
- Exactly ‘how’ we did it
- Reveal the ‘common Facebook mistakes’ that was costing this campaign a lot of sales (and could be currently costing you sales)
- How you can use the same ‘enprofit driving approach’ to extra more sales from your current Facebook ad campaigns
The Failing Facebook Ad Campaign
This particular client had started out selling on Facebook successfully a few years ago.
They had managed to achieve a return on ad spend (ROAS) of 4.1 – 5.8 (anything above 4.5x was considered fantastic and very profitable). Unfortunately, their recent Facebook results were declining – rapidly.
Recently, things went from bad to worse for them:
- They started losing money, even though they were spending over 15k per month!
- Traffic from Facebook not only decreased, their sales conversion rates were hit hard hard
- On their worst month, their ROAS from Facebook ads went down to 2.8, causing them to lose money (their absolute breakeven point was an ROAS of 3.1)
After a referral from one of our clients, they turned to us in a last-ditch effort to recover Facebook as a profitable sales channel.
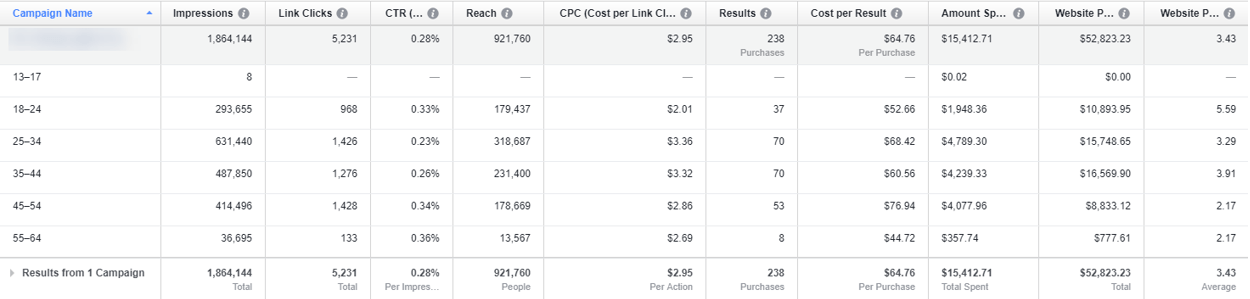
Looking at the results in the month prior to our involvement (July 2017), they had achieved a ROAS of 3.43:
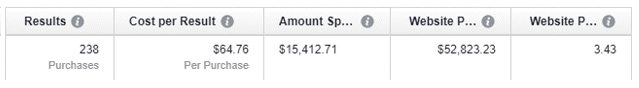
At a ROAS 3.43, they were still barely making any profit.
They were questioning whether to continue with Facebook advertising at all!
To make matters worse, the trend was not on their side.
The results of the last week of August showed even worse results:
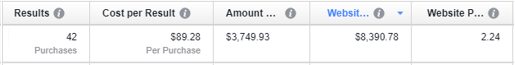
Given their 3.1 breakeven multiple, they had actually lost money.
Our challenge was to turn this losing campaign into a profitable one by increasing ROAS above 4.5
We were given two months and thirty-five thousand dollars in ad spend to prove ourselves.
Limiting Data Analysis to Recent Events in Facebook
My first step was to find out which factors were contributing to most of their sales.
Because ‘recency’ plays such a big role on Facebook, and given their campaign was showing more promise in the last month than the previous few, I chose to stick my analysis to their last month as a solid starting point.
(I generally don’t find too many nuggets of useful wisdom by going back too far – things change far too quickly on Facebook.)
By their own admission, “what was working a year ago had stopped working” – and “what was working six months ago failed spectacularly”

How To Uncover Huge Sales Opportunities With Facebook Ads
After managing millions in Facebook Ad spend, I’ve discovered that, more often than not, getting the most out of Facebook Ads means getting the most out of one or more of these powerful three areas:
- Audience (and attributes). This can be broken down into a few great sub-leverage point areas:
- The ‘list’ you target
- Age group
- Gender
- What you’re optimising for (here, they were optimising for conversions, so there was nothing to change)
- Placement
- Offer – Facebook offers can get stale quickly, especially if you’re marketing to the same audience.
- Ad Type – Vital – Collection ads had just been recently released, and we were using them with a lot of success for other our e-commerce clients.
Although our internal optimisation systems are more complex, improvements in these three broad areas have proven time and time again to lead to significant increases in sales.
So our first step was discovering how the current campaign was making use of these three powerful areas.
Here’s what we discovered:

1. Current Audience Findings:
- There was only simple interest targeting (very general), and these had not been set up scientifically and deliberately. It looked more like a spray and pray approach.
- Audience retargeting lists (both website retargeting and video view retargeting) was set up and utilised poorly.
- No gender analysis or targeting
- No age analysis or targeting
- And, there was no use of any lookalike audiences based on their customers who actually bought (they were only doing lookalikes of their email list). This is an extremely powerful audience to use, especially for e-commerce.

2. Current Gender Analysis:
We ran a gender analysis of the previous months campaigns:
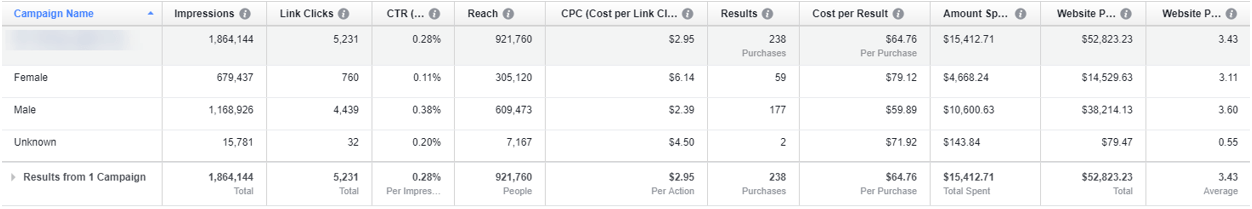
Our client was selling a product that was generally appealing to males.
So, I wasn’t surprised to see that most of the budget had gone to male targeting, and had the highest ROAS.
Our client had even considered cutting out females from their targeting all together, and put that forward to us as a suggestion.
Given how loose their targeting was, I didn’t want to dismiss 50% of the population so easily.

3. Current Age Analysis:
An age breakdown analysis revealed the following:
From the above, it was abundantly clear that the ages to focus on was the 18 – 45 year olds.
Grouping the above ad spend and revenue figures to 18 – 44 year olds, and then 45 – 64 year olds looked like this:
| Total Spent | Sales | ROAS | |
|---|---|---|---|
| 18-44 | $10,976.99 | $43,212.50 | 3.94 |
| 45-64 | $4,435.69 | $9,610.73 | 2.17 |
If we had done nothing else but limited the age demographic to 18 – 45 year olds, we could have immediately increased ROAS from 3.43 ROAS to a ROAS 3.94.
This sort of age analysis and targeting would have taken 5 minutes, yet would have increased sales 15% immediately, creating an additional $7,860.48 in sales per month – for FREE!
Not bad for 5 minutes work!
Age segmentation would have meant that we would have been nearly half way to our 4.5 goal.
Technically, if we had limited our age to 18 – 24, we would have beaten our target, but I didn’t want to limit the audience so much and miss out on other potentially profitable age groups.

4. Current Age & Gender Analysis Combined:
An age and gender breakdown revealed the following:
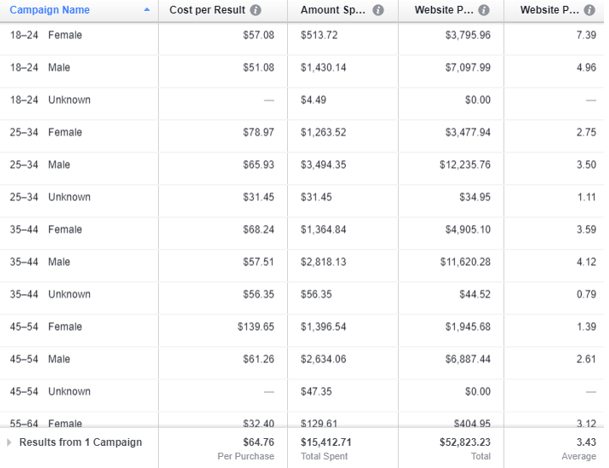
This further confirmed that the 18 – 44 demographic was the one to focus on.
Every group in this age and gender combination was returning over the 3.1 ROAS breakeven point, EXCEPT for females of 25-34.
That being said, females aged between 18 – 24 provided the highest return on ad spend, exceeding any figure my client had done before. This provided a further reason to not exclude females from our audiences.

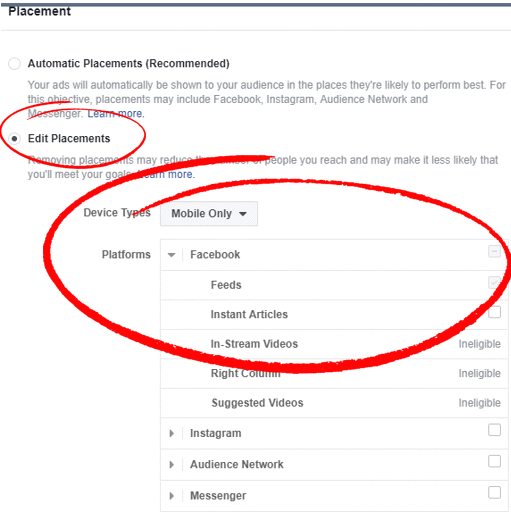
5. Current Placement Analysis:
This breakdown was one of the most insightful.
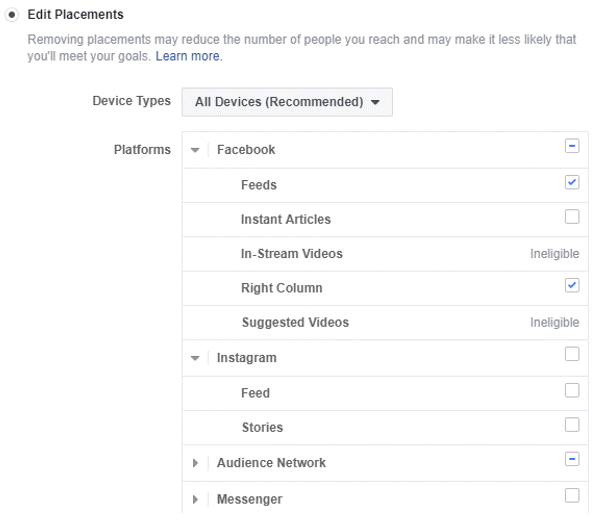
Most of the adsets our client was running had the following placement settings:
A placement breakdown revealed the following:
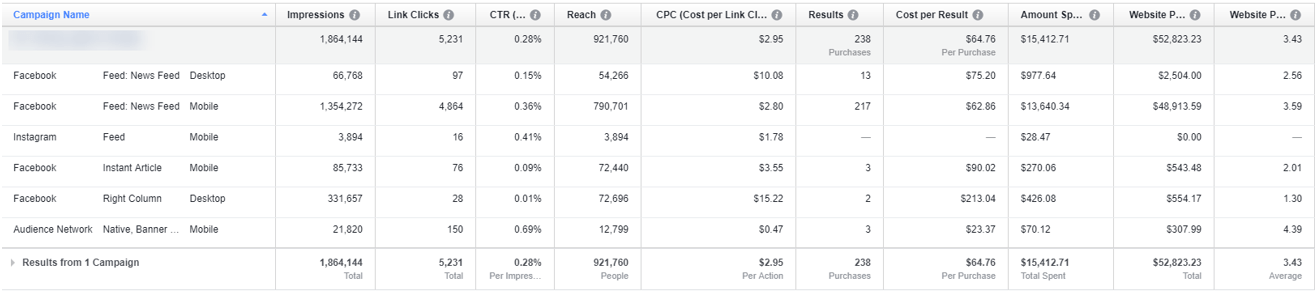
What stood out was mobile traffic, particularly mobile newsfeed traffic. Mobile news feed traffic accounted for:
- 92.98% of their traffic
- 88.69% of their ad spend; and
- 92.60% of their sales
It also clearly had the highest ROAS at 3.59 for any meaningful spend.
Audience network showed a 4.39 – but I was highly skeptical here. This is because there wasn’t enough spend to trust the results, nor has audience network provided consistent results across all our clients (including this client upon analysis by campaign).
I wanted to focus on where I was comfortable making a return, and doing it quickly.

6. Current Ad Type Analysis:
The current campaigns were using a single video with the featured product – randomly testing multiple videos and rotating them.
Some offers with image ads were being used, but more than 95% of the current ad spend went to video ads.
Their most recent video seemed to be working well.
Collection ads (mobile only ads) had just been released, and were currently not being utilised by the client.
With knowledge of collection ads performing well for some of my other clients, I was really keen to incorporate collections ads in our test.

7. Offer Analysis:
The current offer was $177 with free shipping.
We were told that the free shipping was clearly the winner across all their marketing, based on their previous tests.
These valuable insights gave us a solid base to start improving their figures.
Want More Revenue Boosting Insights?

All The Facebook Targeting Options We Used To Turn This Losing Campaign Into A Wildly Profitable One
To increase our sales above our target ROAS (and get there fast) we knew each of the elements in the list above had to be optimised to perform at the highest possible level.
Here’s what we did – and why:

1. Audience Used (List, Age, Gender and Placement)
Given the loose current campaign targeting, and the lack of segmentation, we saw this as one of the potential greatest areas of improvement.
After the analysis above, we chose not to limit the targeting to males – as we wanted to aim for both genders.
My plan was to watch it closely, and if there was a clear difference, I would split the gender into different adsets to target.
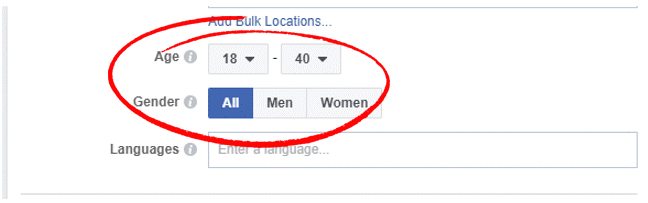
We did, however, want to place an age limit on non-website retargeting lists, to 18-40 year olds.
Given the contribution of mobile to over 90% in sales, we also decided to only focus on mobile placements.
This is what our placement targeting looked like for all BUT the website retargeting audiences (audiences 1 and 2):
For website retargeting, we didn’t limit the age group.
Audiences Created:
We created the following audiences:
- Retargeting – Added to cart retargeting (180 days) – visitors who viewed the primary product page (that we’re promoting in the Facebook video) AND visitors who added our product to cart (must satisfy both conditions)
- Retargeting – Product category retargeting (exc. added to cart – 180 days)– Visitors who viewed our product and product category page but DID NOT add to cart
- Video view retargeting (love this one) – this is a retargeting list we created in Facebook of anyone who watched more than 3 seconds of a video we promoted on Facebook (we’ve done this test with 25%, 50%, AND other variations too, but for this test we kept the video view retargeting very loose to keep conditions as similar as possible)
- Product buyers Lookalike audience 1% – This is a 1% Lookalike (LAL) audience of buyers who have bought at least one item of that product
- Product category buyers Lookalike audience (one of my favourite cold audiences) – This is a 1% Lookalike (LAL) audience of buyers who have bought at least one item from that product category, or products closely related to the promoted product
- Lookalike of all other products buyers 1% (this is the lookalike of all the product category buyers, NOT INCLUDING the buyers who have bought the actual product we are promoting).
- Interest Based Targeting Only
For retargeting audiences 1 & 2, we had the following attributes:
- Both Male and Female
- No Age limitations (we figured if they went on site, they already have an interest) – this is a retargeting list
- Excluded those that had bought the product (who were in the ‘customers customer list’)
- Automatic bidding – to optimise conversions with a 7-day conversion window
For Audiences 3 – 7, we had the following attributes:
- Both Male and Female
- Limited age from 18-40
- Excluded those that had bought the product (were in ‘customers customer list’)
- Automatic bidding – to optimise conversions with a 7-day conversion window

2. Ad Types Used
Given that their video ads were pulling in most of the sales, we decided we wanted to focus on ad types centred around video.
Also, given that we limited targeting to MOBILE NEWSFEED ONLY, the timing of this was perfect to try the new collection ads. I had a lot of faith in being able to use them effectively.
So, we decided to split test the single video ad against the new Facebook Collection ad, to see what the impact would be (for this, we had a to do a bit of work setting up their feed).
We tested the different offers with long copy on the text (we were achieving some great success with long copy video ads with our other clients).

3. Offers Used
In addition to their $177 free shipping offer, I urged them to test at least two new offers.
Our tests have shown, time and time again that keeping offers fresh on Facebook has huge benefits.
We agreed on testing two new offers:
- One without free shipping, a lower price point at $157 (with no mention of free shipping, they would add on the shipping later for $20)
- The other with their original offer of free shipping – but also convinced them to add a small freebie that cost them less than $3 to make
So, our strategy to turn this campaign on its head was now in place.
As always, the proof would be in figures.

The Results After 2 Months –
An Extra $102,580.47 in Sales!
Having taken on this challenge, we felt a little nervous, but confident about hitting the target ROAS of 4.5.
Especially given only a two-month window to get there.
Overall Campaign Results:
After 2 months and $35,392.41 in ad spend, we achieved the following in sales, return on ad spend (ROAS), number of sales (#sales), cost per sale (CPS), and average order value (AOV) …
| CAMPAIGN OVERALL | Amount Spent | Sales | ROAS | # Sales | CPS | AOV |
|---|---|---|---|---|---|---|
| Old Campaign (1 Month) | $15,412.71 | $52,823.23 | 3.43 | 238 | $64.76 | $221.95 |
| New Campaigns (2 Months) | $35,392.41 | $223,976.44 | 6.33 | 966 | $36.64 | $231.86 |
Want More Revenue Boosting Insights?
As you can imagine, our client was over the moon.
A 6.33 ROAS meant that my client was now achieving a 105% ROI on his spend. In fact, he told me their Facebook ads went…
From barely breaking even to profiting over $16,000 per month, on the same monthly spend!
At a 3.43 ROAS (what he achieved in his month before us), sales for the same spend from their previous campaign would have been $121,395.97 vs the $223,976.44 achieved.
The 3.43 is actually being generous as his prior months returns were much less than this.
Our changes conservatively created an an extra $102,580.47 in two months for NO additional spend.
(This is why we spent $5,000 more than the initial allocated budget – he urged us to do so given the sales he was getting)
Overall Analysis – New Campaigns vs. Old:
We increased ROAS% close to 85%, and achieved this through a:
- Drop in % cost per sale (CPS) of 43.42%
- And an increase in average order value (AOV) of 4.47%
| CAMPAIGN ANALYSIS | ROAS % | CPS % | AOV % |
|---|---|---|---|
| New Vs Old | +84.65% 6.33/3.43 | -43.42% 36.64/64.76-1 | +4.47% 231.86/221.95 |
(Both the client, and my team were over the moon.)
Overall Offer Analysis:
Here are the results by offer:
Offer1:
Offer 2:
Offer Results Summary:
| OFFERS | Amount Spent | Sales | ROAS | # Sales | CPS | AOV |
|---|---|---|---|---|---|---|
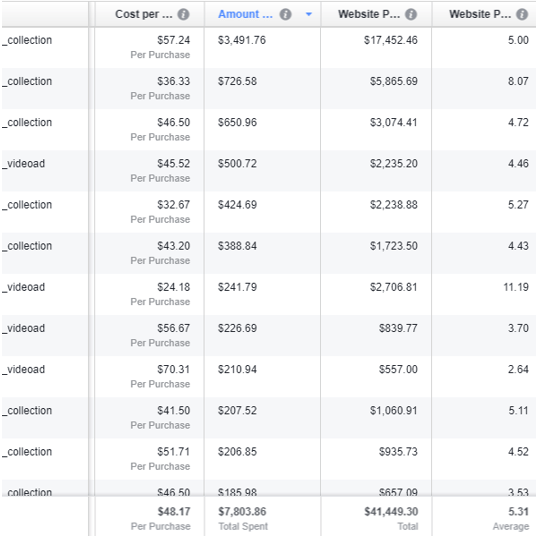
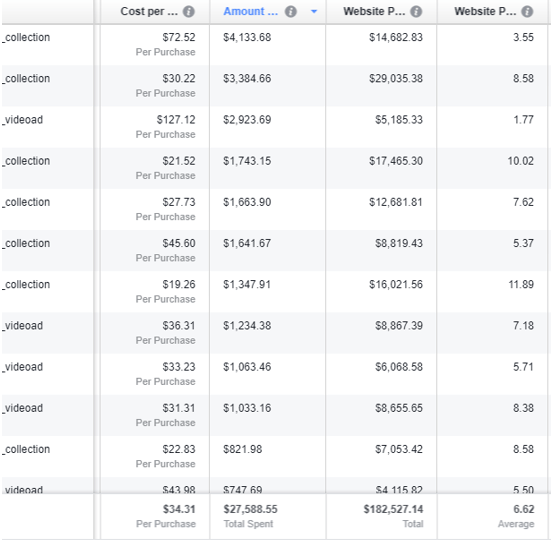
| Old offers | $15,412.71 | $52,823.23 | 3.43 | 238 | $64.76 | $221.95 |
| New Offer 1 | $7,803.86 | $41,449.30 | 5.31 | 162 | $48.17 | $255.86 |
| New Offer 2 | $27,588.55 | $182,527.14 | 6.62 | 804 | $34.31 | $227.02 |

Both offers completely destroyed the original offer.
This result is consistent with what we’ve seen with Facebook advertising.
Offers tend to work in Facebook really well for a period of 1-5 weeks (depending on audience size etc.) before they need to be changed.
The offer really contributed to this result, but I also know that our careful audience targeting helped immensely.
Here’s how each of the new offers fared against the original offer:
| OFFER ANALYSIS | ROAS % | % CPS | AOV% |
|---|---|---|---|
| Offer 1 | +54.98% | -25.61% | +15.28% |
| Offer 2 | +93.04% | -47.01% | +2.29% |
New offer two sold 93% better than the original offer.
Offer one also beat the original offer by a significant margin.

Overall Gender Analysis:
Here’s a telling comparison of the Old Campaigns Vs. New Campaigns:
| Gender Analysis | Amount Spent | Sales | ROAS | # Sales | CPS | AOV | |
|---|---|---|---|---|---|---|---|
| Old Campaigns | female | $4,668.24 | $14,529.63 | 3.11 | 59 | $79.12 | $246.26 |
| male | $10,600.63 | $38,214.13 | 3.60 | 177 | $59.89 | $215.90 | |
| unknown | $143.84 | $79.47 | 0.55 | 2 | $71.92 | $39.74 | |
| $15,412.71 | |||||||
| New Campaigns | female | $7,788.43 | $55,320.04 | 7.10 | 241 | $32.32 | $229.54 |
| male | $27,339.04 | $167,790.82 | 6.14 | 720 | $37.97 | $233.04 | |
| unknown | $264.94 | $865.58 | 3.27 | 5 | $52.99 | $173.12 | |
| $35,392.41 |
Both genders completely smashed the old campaign with our new targeting.
What was extremely surprising and notable, is that females did better than males – in an industry that was more appealing to males overall.
It would have been really easy to dismiss females, given the poorer original performance, but that would have been a mistake.
Females returned an ROAS of 7.1, and males returned an ROAS of 6.14 – returns that were unprecedented.
New Campaign Performance – Segmented By Gender:
Here’s a comparison of the performance of the new campaign compared to the old campaign, segmented by Gender:
| Gender | ROAS % | % CPS | Increase In $ per purchase |
|---|---|---|---|
| Female | +128.21% | -59.16% | -6.79% |
| Male | +70.25% | -36.60% | +7.94% |
Male ROAS increased to over 70%!
This was mostly driven by a decrease in CPS of nearly 37%, with a little help in the average order value increase of close to 8%.
Female ROAS increased over 100% – creating more than double the sales for the same spend!
We achieved this through a massive decrease in cost per sale of close to 60%.
Our solution was clearly having a huge positive effect.
It again proved that the original suggestion of excluding females in our targeting would have been a severe mistake. They ended up being more profitable than males!

Overall Age Analysis:
Although we limited our age targeting to mostly 18 – 40 audiences, the shares and comments we ended up receiving created traction in other age groups.
This led to quite a few sales for those over 40 – the retargeting audiences really resonated with those older than 40.
In fact, the 45-55 age group grew the most in terms of ROAS% – over 200%!
This made us rethink this age group, and it may be that in future we will expand the age to this age group targeting.
Results Segmented By Age:
| Age Analysis | Amount Spent | Sales | ROAS | # Sales | CPS | AOV | |
|---|---|---|---|---|---|---|---|
| Old Campaigns | 13-17 | $0.02 | |||||
| 18-24 | $1,948.35 | $10,893.95 | 5.59 | 37 | $52.66 | $294.43 | |
| 25-34 | $4,789.32 | $15,748.65 | 3.29 | 70 | $68.42 | $224.98 | |
| 35-44 | $4,239.32 | $16,569.90 | 3.91 | 70 | $60.56 | $236.71 | |
| 45-54 | $4,077.95 | $8,833.12 | 2.17 | 53 | $76.94 | $166.66 | |
| 55-64 | $357.75 | $777.61 | 2.17 | 8 | $44.72 | $97.20 | |
| New Campaigns | 13-17 | $141.12 | $1,898.12 | 13.45 | 10 | $14.11 | $189.81 |
| 18-24 | $9,683.57 | $69,128.59 | 7.14 | 295 | $32.83 | $234.33 | |
| 25-34 | $14,345.93 | $83,594.84 | 5.83 | 368 | $38.98 | $227.16 | |
| 35-44 | $7,679.87 | $46,872.28 | 6.10 | 195 | $39.38 | $240.37 | |
| 45-54 | $2,337.97 | $16,105.78 | 6.89 | 64 | $36.53 | $251.65 | |
| 55-64 | $921.79 | $4,474.60 | 4.85 | 25 | $36.87 | $178.98 | |
| 65+ | $282.16 | $1,902.23 | 6.74 | 9 | $31.35 | $211.36 |
New Campaign Performance – Segmented By Age:
| AGE | ROAS % | % CPS | AOV % |
|---|---|---|---|
| 18-24 | +27.67% | -37.66% | -20.41% |
| 25-34 | +77.21% | -43.02% | +0.97% |
| 35-44 | +56.15% | -34.97% | +1.55% |
| 45-54 | +218.03% | -52.52% | +51.00% |
| 55-64 | +123.33% | -17.55% | +84.14% |
All age groups showed a significant increase in performance compared to the old campaign. A testimony to how important the three areas above to Facebook Ad success.
All age groups, except the 18 -24 group had BOTH a decrease in percentage cost per sale (CPS) and an increase in average order value (AOV).
Ad Type Analysis:
Of particular interest to us in this particular test, was how the new collection ads fared against the single video ads.
Campaign Results – Segmented By Ad Type:
| Ad Type | Amount Spent | Sales | ROAS | # Sales | CPS | AOV | |
|---|---|---|---|---|---|---|---|
| Old Campaign | Single Video Ads | $15,412.71 | $52,823.23 | 3.43 | 238 | $64.76 | $221.95 |
| New Campaign | Collection Ads | $24,677.80 | $167,098.53 | 6.77 | 706 | $34.95 | $236.68 |
| New Campaign | Single Video Ads | $10,714.61 | $56,877.91 | 5.31 | 260 | $41.21 | $218.76 |
Compared to the original ads they were running, collection ads nearly doubled the return they were getting:
| Ad Analysis | ROAS % | % CPS | AOV% |
|---|---|---|---|
| Collection | +97.57% | -46.02% | +6.64% |
| Video | +54.89% | -36.36% | -1.44% |
This was welcomed, but not unexpected, because in a study we conducted across 13 campaigns, collection ads outperformed the single video ads by over 20%! (definitely worth testing them out yourself).
The additional work of getting their feeds set up was more than worth it.
Audience Analysis:
This was one of the most interesting areas for me.
The combination of the audience targeting, the age limitations, offers and ad type had resulted in a significant net increase.
But, I was really interested to know how each specific audience segment contributed to the overall results.
I analysed each audience we tested and segmented it by an element I believed was fairly important given Facebook’s recent updates – Ad type.
Audience 1 Results:
Results of Audience 1 – retargeting to those who visited the product and checkout page:
| Audience 1 | |||||||
|---|---|---|---|---|---|---|---|
| Ad type | Cost | Sales | ROAS | # Sales | CPS | AOV | |
| Collection | $742.51 | $5,834.50 | 7.86 | 20 | $37.13 | $291.73 | |
| Single Video | $354.21 | $1,060.51 | 2.99 | 7 | $50.60 | $151.50 |
Comparing the ROAS% change, CPS% change and AOV% to the original campaign:
| Ad Type | ROAS% | CPS% | AOV% | |
|---|---|---|---|---|
| Collection | +129.27% | -42.67% | +31.44% | |
| Single Video | -12.64% | -21.86% | -31.74% | |
For audience one, although the spend was only just over $1,000 in total, single video ads performed worse.
Collection ads on the other hand more than doubled the return on ad spend!
As you can see from the rest of the audience figures below, our unique audience analysis process and decision to utilise collection ads paid off big time …
Audience 2 Results:
Results of Audience 2 – retargeting those that visited the product category but did not add to cart in the last 180 days:
| Ad type | |||||||
|---|---|---|---|---|---|---|---|
| Cost | Sales | ROAS | # Sales | CPS | AOV | ||
| Collection | $7,372.74 | $72,201.71 | 9.79 | 307 | $24.02 | $235.18 | |
| Single Video | $1,881.17 | $13,596.67 | 7.23 | 73 | $25.77 | $186.26 |
Comparing the ROAS% change, CPS% change and AOV% to the original campaign:
| Ad Type | ROAS% | CPS% | AOV% | |
|---|---|---|---|---|
| Collection | +185.74% | -62.92% | +5.96% | |
| Single Video | +110.89% | -60.21% | -16.08% | |
Both ad types performed better, but collections delivered a whopping 9.79 ROAS, and nearly tripled the returns of the original campaign!
Audience 3 Results:
Results of Audience 3 – video view retargeting to those that watched at least 3 seconds of the video:
| Ad type | |||||||
|---|---|---|---|---|---|---|---|
| Cost | Sales | ROAS | # Sales | CPS | AOV | ||
| Collection | $2,030.51 | $10,542.93 | 5.19 | 45 | $45.12 | $234.29 | |
| Single Video | $1,278.82 | $8,867.39 | 6.93 | 34 | $37.61 | $260.81 |
Comparing the ROAS% change, CPS% change and AOV% to the original campaign:
| ROAS% | CPS% | AOV% | |
|---|---|---|---|
| Collection | +51.50% | -30.32% | +5.56% |
| Single Video | +102.32% | -41.92% | +17.51% |
For audience 3, the single video ad more than doubled the return of the original offer, and also beat collection adds reversing the trend we saw with audiences 1 and 2.
Because this was a retargeting audience of everyone who had seen the video, familiarity of the video may have played a part here.
Audience 4 Results:
Results of Audience 4 – a lookalike audience of anyone that bought the specific product we are promoting:
| Ad type | |||||||
|---|---|---|---|---|---|---|---|
| Cost | Sales | ROAS | # Sales | CPS | AOV | ||
| Collection | $1,289.52 | $8,620.67 | 6.69 | 36 | $35.82 | $239.46 | |
| Single Video | $1,297.97 | $13,177.42 | 10.15 | 50 | $25.96 | $263.55 |
Comparing the ROAS% change, CPS% change and AOV% to the original campaign:
| ROAS% | CPS% | AOV% | |
|---|---|---|---|
| Collection | +95.06% | -44.69% | +7.89% |
| Single Video | +196.22% | -59.91% | +18.74% |
Single video once again outperformed significantly, nearly doubling the collection ad results and nearly tripling the original offers results.
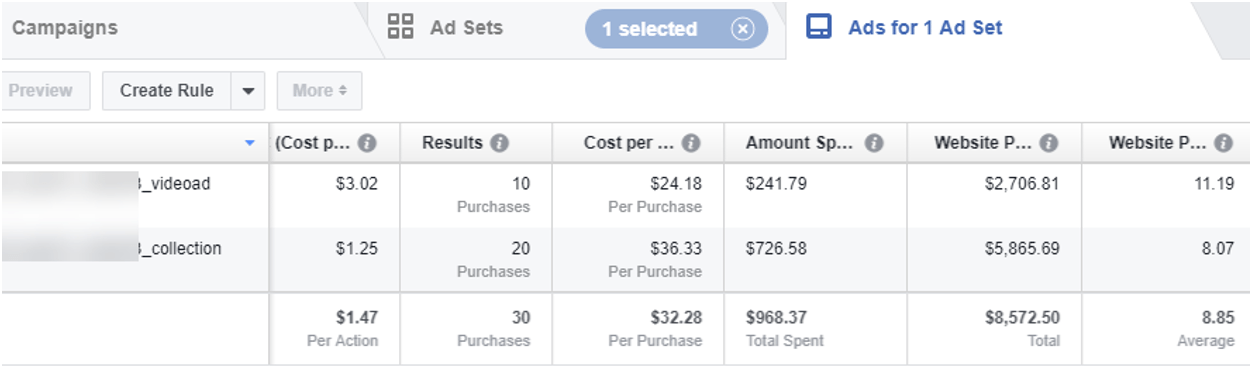
It was also interesting to see, that the following combination:
- Audience 4
- New Offer 1 (Freebie)
- Single Video ad
Produced the highest ROAS multiple out of any other combination – a MASSIVE 11.19 ROAS:
Audience 5 Results:
Results of Audience 5 – a lookalike audience of anyone that bought a product in the same category that we’re promoting:
| Ad type | |||||||
|---|---|---|---|---|---|---|---|
| Cost | Sales | ROAS | # Sales | CPS | AOV | ||
| Collection | $633.97 | $3,147.48 | 4.96 | 17 | $37.29 | $185.15 | |
| Single Video | $297.95 | $839.77 | 2.82 | 4 | $74.49 | $209.94 |
Comparing the ROAS% change, CPS% change and AOV% to the original campaign:
| ROAS% | CPS% | AOV% | |
|---|---|---|---|
| Collection | +44.86% | -42.41% | -16.58% |
| Single Video | -17.76% | +15.02% | -5.41% |
Collection ads outperformed the original campaign, however single video surprisingly underperformed the original campaign.
Audience 6:
Results of Audience 6 – a lookalike audience of anyone that bought a product in the same category, less those that bought the specific product we are promoting:
| Ad Type | |||||||
|---|---|---|---|---|---|---|---|
| Cost | Sales | ROAS | # Sales | CPS | AOV | ||
| Collection | $466.88 | $1,817.91 | 3.89 | 11 | $42.44 | $165.26 | |
| Single Video | $742.77 | $2,935.44 | 3.95 | 16 | $46.42 | $183.47 |
Comparing the ROAS% change, CPS% change and AOV% to the original campaign:
| ROAS% | CPS% | AOV% | |
|---|---|---|---|
| Collection | +13.61% | -34.46% | -25.54% |
| Single Video | +15.31% | -28.31% | -17.34% |
This was a close call. For audience 6, although both collection ads and single video ads outperformed the original campaign, single video ads slightly beat collection ads.
Audience 7:
Results of Audience 7 – interest only targeting:
| Audience 7 | Interest Based targeting | ||||||
|---|---|---|---|---|---|---|---|
| Cost | Sales | ROAS | # Sales | CPS | AOV | ||
| Collection | $8,730.71 | $37,206.34 | 4.26 | 141 | $61.92 | $263.87 | |
| Single Video | $2,928.00 | $5,185.33 | 1.77 | 23 | $127.30 | $225.45 |
Comparing the ROAS% change, CPS% change and AOV% to the original campaign:
| ROAS% | CPS% | AOV% | |
|---|---|---|---|
| Collection | +24.34% | -4.38% | +18.89% |
| Single Video | -48.33% | +96.58% | +1.58% |
Collection ads significantly beat single video ads for general interest targeting.
Single video ads actually bombed for this audience group.
This was the only targeting this client was originally doing, so this was the sort of results they could have expected if they had continued doing Facebook ads as they were before, and they changed only the offer and ad type.
A testimony to how much of an impact audience selection makes to overall sales.
For a further detailed view of the figures – and some remarkable results from twelve other campaigns, our article Facebook Collection vs. Facebook Single Video – The 177,843.34 Facebook Ad Test reveals all.
If you’re interested, this particular campaign was campaign No.9 in that test.

Overall Summary
So, our two months were up, and the results were in.
Our client’s turnaround had gone from barely breaking even (and sometimes as low as 2.8 and losing money from Facebook ads) to an overwhelming campaign success of:
- An overall 6.33 ROAS (they had NEVER achieved results like this in the past, even in their most profitable periods)
- An extra $102,580.47 in sales over a two month period for no additional spend
- An average drop in their cost per sale of 43.42%
- An average increase in average order value 4.47% ; and
- A whopping sales growth of 84.65%
The conclusion was a proud team, and an ecstatic client (with their faith in Facebook advertising restored).
If your Facebook advertising is suffering the same ‘profit sapping’ fate as our client – or you want to add further power to a campaign that’s working – test the above methods on your own campaign.
It could make a huge difference to your sales – and propel your Facebook advertising to a whole new level.
I hope the insights I’ve shared with you help you to get there – fast.
YOUR TURN:
Have you successfully turned failing Facebook ads around? If so, what were the one or two key points that made all the difference?
Hit the comments below. I’d love to know.